Statistics and PowerBI Visualizations, Part Two
In the previous post, we went over the details of DBCC_SHOW_STATISTICS, now let’s see how this comes together. We shall run the histogram for the ProductID from the Sales.SalesOrderDetail table.
DBCC	SHOW_STATISTICS('Sales.SalesOrderDetail', IX_SalesOrderDetail_ProductID)
WITH	HISTOGRAM
--	Review the section for range 826 - 831
GO
Pay attention to the Range_HI_Key of 831. The Avg_Range_Rows are 36 2/3.
Now let’s run a query to see how SQL Server uses these statistics to create an execution plan.
        SELECT  productID               ,
	        Count(1) as Total
        FROM    Sales.SalesOrderDetail
        WHERE   ProductID BETWEEN 827 and 831
        GROUP   BY ProductID            ;
        GO
Let’s look at the execution plan below. I’m using SQL Sentry Plan Explorer to show my execution plan. You can see that the estimated number of records coming from the index for ProductID is 308.
So how did the optimizer come to this? The range for the ProductID in the query is 827 to 831. This includes the entire range of the step, including the Range_Hi_Key. In the previous post, we mentioned that the Range_Rows is the estimated count of the rows in the step, EXCLUDING the Range_HI_Key and the EQ_Rows is the estimated number of rows for columns who have the value of the Range_HI_Key. The number 308 is the summation of the EQ_Rows and Range_Rows.
Query on Range_HI_Key
Now let’s see what happens when we query the Range_Hi_Key exactly
           SELECT  productID               ,
	        Count(1) as Total
        FROM    Sales.SalesOrderDetail
        WHERE   ProductID = 831
        GROUP   BY ProductID            ;
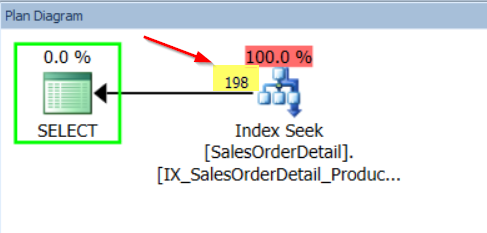
When we look at the estimated execution plan, you will see the estimated number of rows is 198. This is the value for EQ_Rows which is the estimated number of rows for columns who have the value of the Range_HI_Key.
Query on Step excluding Range_HI_Key
Finally, we shall see how SQL Server estimates the records for a value within the step excluding the Range_HI_Key.
         SELECT  ProductID
        FROM    Sales.SalesOrderDetail
        WHERE   ProductID = 828         ;
        GO
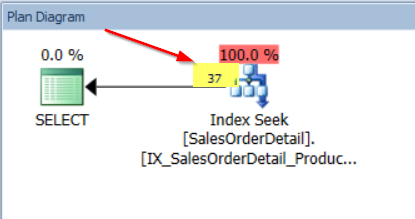
Now, SQL Sentry Plan Explorer is rounding the estimated number of 36.66667, but this is the value of the Avg_Range_Rows which is the average number of records, with duplicate values within the step, excluding the Range_HI_Key.
Old versus New
When I was putting together the lesson plans for this, I wanted to make my own query for the comparisons, not borrow one from another site or blog. Yes, I borrow plenty, but I wanted this to be mine. When I was presenting my “code tuning” class, I had recently upgraded my instance from 2012 to 2017. I had also put my database into 2017 compatibility mode. I had used this query to show that unions that are intensive can cause issues with tempdb and cause spill over. To my “joy”, when I ran the query in the class I did not get the tempdb spillover. And right then I realized that I was not in Kansas(2012 compatibility) any longer. But this proved to be opportunistic for the statistics/optimizer comparison.
So here, let’s see the query in 2012(Cardinality Estimator 7) compatibility.
           USE [master]
        GO
        ALTER DATABASE [AdventureWorks2012] SET COMPATIBILITY_LEVEL = 110
        GO

        Use     AdventureWorks2012
        go
        set     statistics io, time on

        SELECT	sh.orderdate			,	sh.shipdate			,
	        sc.CustomerID			,	p.FirstName			,
	        p.LastName			,	st.Name		as TerritoryName
        FROM	[Sales].[SalesOrderHeaderEnlarged] sh
	        INNER JOIN [Sales].[SalesTerritory] st on st.TerritoryID = sh.TerritoryID
	        INNER JOIN [Sales].[Customer] sc on sh.CustomerID = sc.CustomerID
	        INNER JOIN [Person].[Person] p on sh.CustomerID = p.BusinessEntityID
        WHERE	sh.OrderDate between '07.01.2009' and '08.01.2009'
        UNION
        SELECT	sh.orderdate			,	sh.shipdate			,
	        sc.CustomerID			,	p.FirstName			,
	        p.LastName			,	st.Name		as TerritoryName
        FROM	[Sales].[SalesOrderHeaderEnlarged] sh
	        INNER JOIN [Sales].[SalesTerritory] st on st.TerritoryID = sh.TerritoryID
	        INNER JOIN [Sales].[Customer] sc on sh.CustomerID = sc.CustomerID
	        INNER JOIN [Person].[Person] p on sh.CustomerID = p.BusinessEntityID
        WHERE	sh.ShipDate between '08.01.2009' and '09.01.2009'
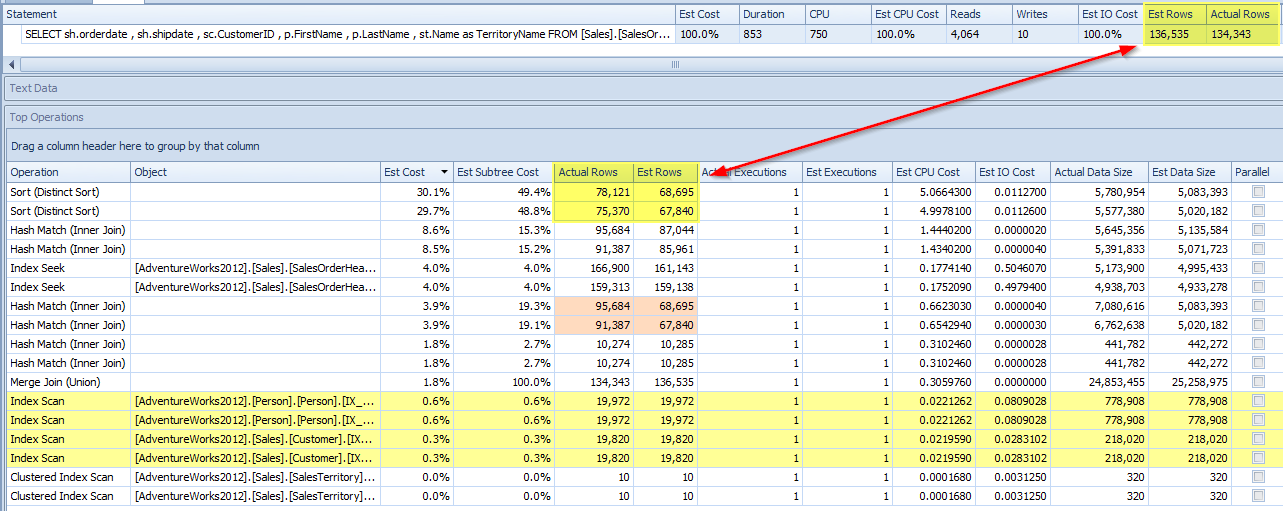
In the screenshot below, you’ll see that Cardinality Estimator 7 under estimates the amount of rows for the sort. Therefore requesting less memory for the query. Since less memory is given to the query, rows have to spill to tempdb for the sorting of the union.
Query in 2017(Cardinality Estimator 14) Compatibility
       USE [master]
        GO
        ALTER DATABASE [AdventureWorks2012] SET COMPATIBILITY_LEVEL = 140
        GO

        Use     AdventureWorks2012
        go
        set     statistics io, time on

        SELECT	sh.orderdate			,	sh.shipdate			,
	        sc.CustomerID			,	p.FirstName			,
	        p.LastName			,	st.Name		as TerritoryName
        FROM	[Sales].[SalesOrderHeaderEnlarged] sh
	        INNER JOIN [Sales].[SalesTerritory] st on st.TerritoryID = sh.TerritoryID
	        INNER JOIN [Sales].[Customer] sc on sh.CustomerID = sc.CustomerID
	        INNER JOIN [Person].[Person] p on sh.CustomerID = p.BusinessEntityID
        WHERE	sh.OrderDate between '07.01.2009' and '08.01.2009'
        UNION
        SELECT	sh.orderdate			,	sh.shipdate			,
	        sc.CustomerID			,	p.FirstName			,
	        p.LastName			,	st.Name		as TerritoryName
        FROM	[Sales].[SalesOrderHeaderEnlarged] sh
	        INNER JOIN [Sales].[SalesTerritory] st on st.TerritoryID = sh.TerritoryID
	        INNER JOIN [Sales].[Customer] sc on sh.CustomerID = sc.CustomerID
	        INNER JOIN [Person].[Person] p on sh.CustomerID = p.BusinessEntityID
        WHERE	sh.ShipDate between '08.01.2009' and '09.01.2009'
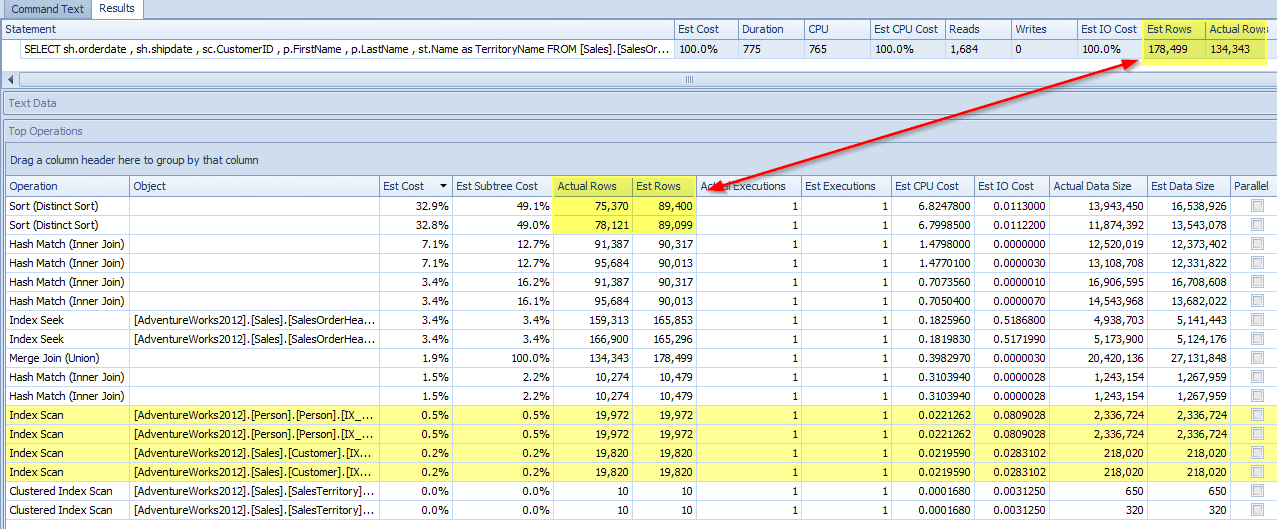
In the screenshot below, you will see that Cardinality Estimator 14 OVER estimates the amount of records for the distinct sort. Also, if you notice and compare the Hash Match Inner Joins to Cardinality Estimator 7 above, CE14 has a much closer value for estimate to actual. This means that the Cardinality Estimator requested more memory for this query and it did NOT need to spill over to tempdb.
Now we see how SQL Server is using the statistics and how the differences in the Cardinality Estimators can determine differences in the execution plans and affect the resources needed.
The next post is where the fun comes in. Running these stats in SSMS doesn’t show much. In the final part, we will show the PowerBI report designed by Mr. Patrick LeBlanc(b|t).


One thought on “Statistics and PowerBI Visualizations, Part Two”